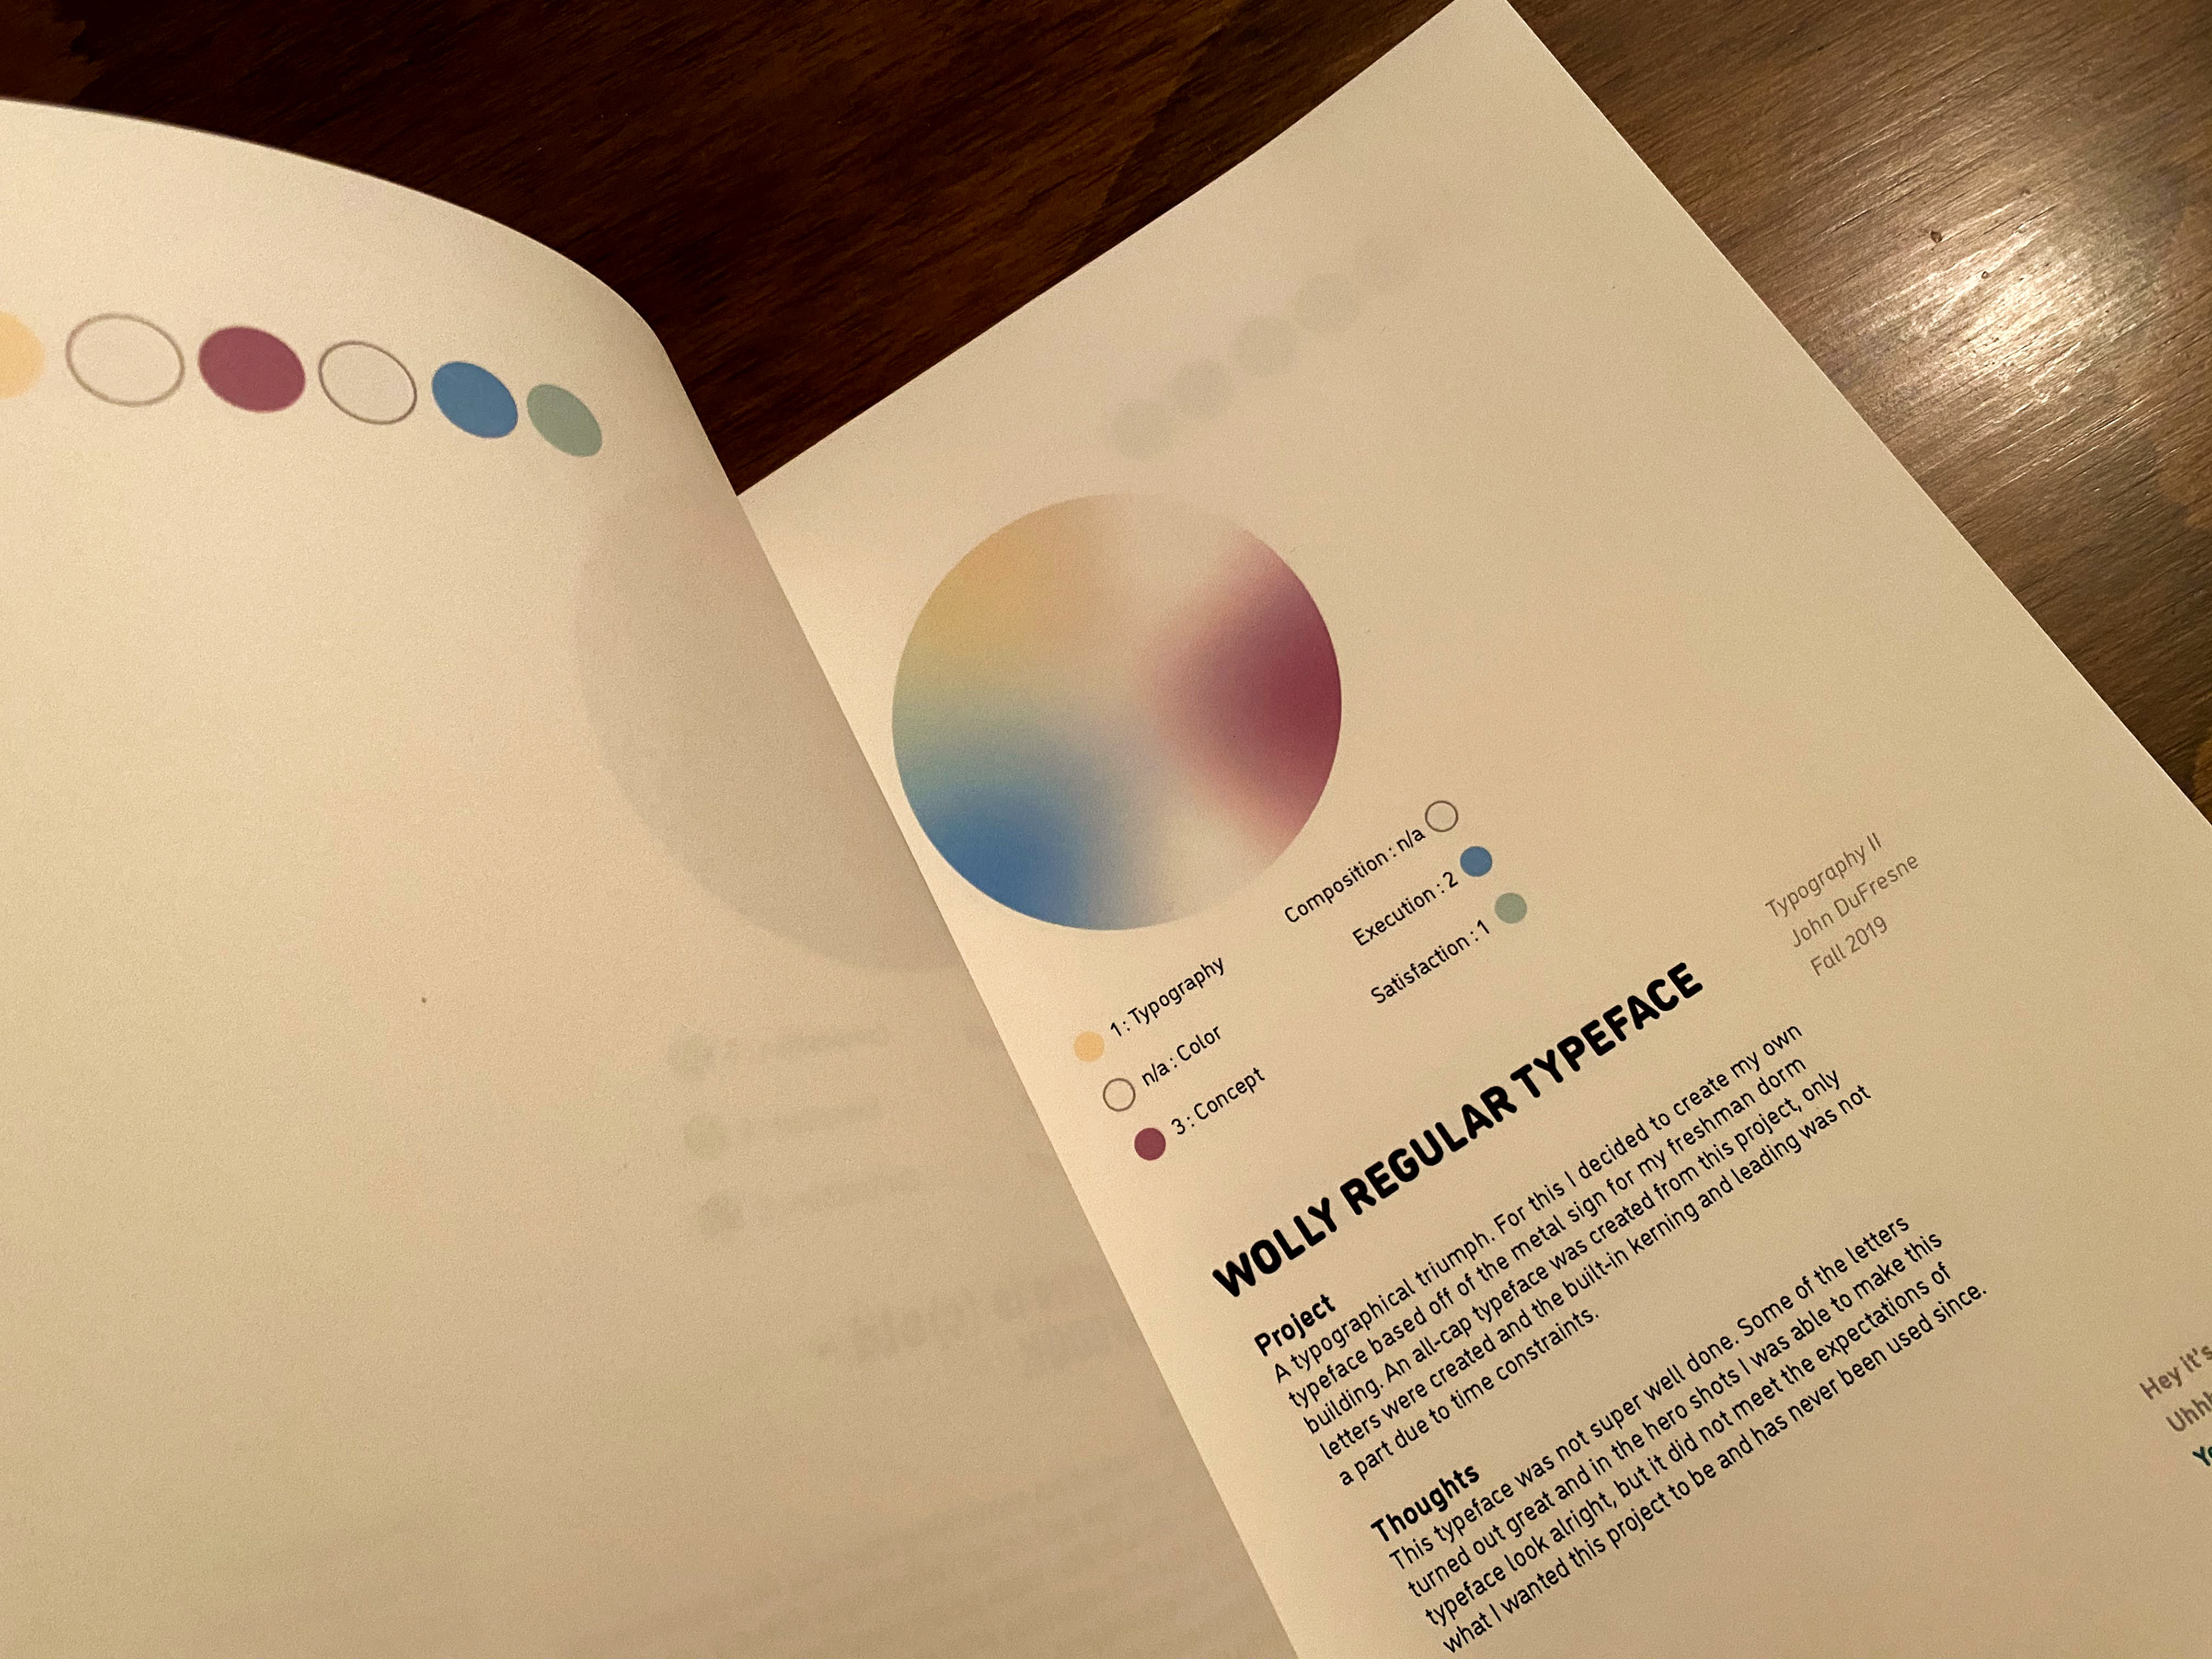
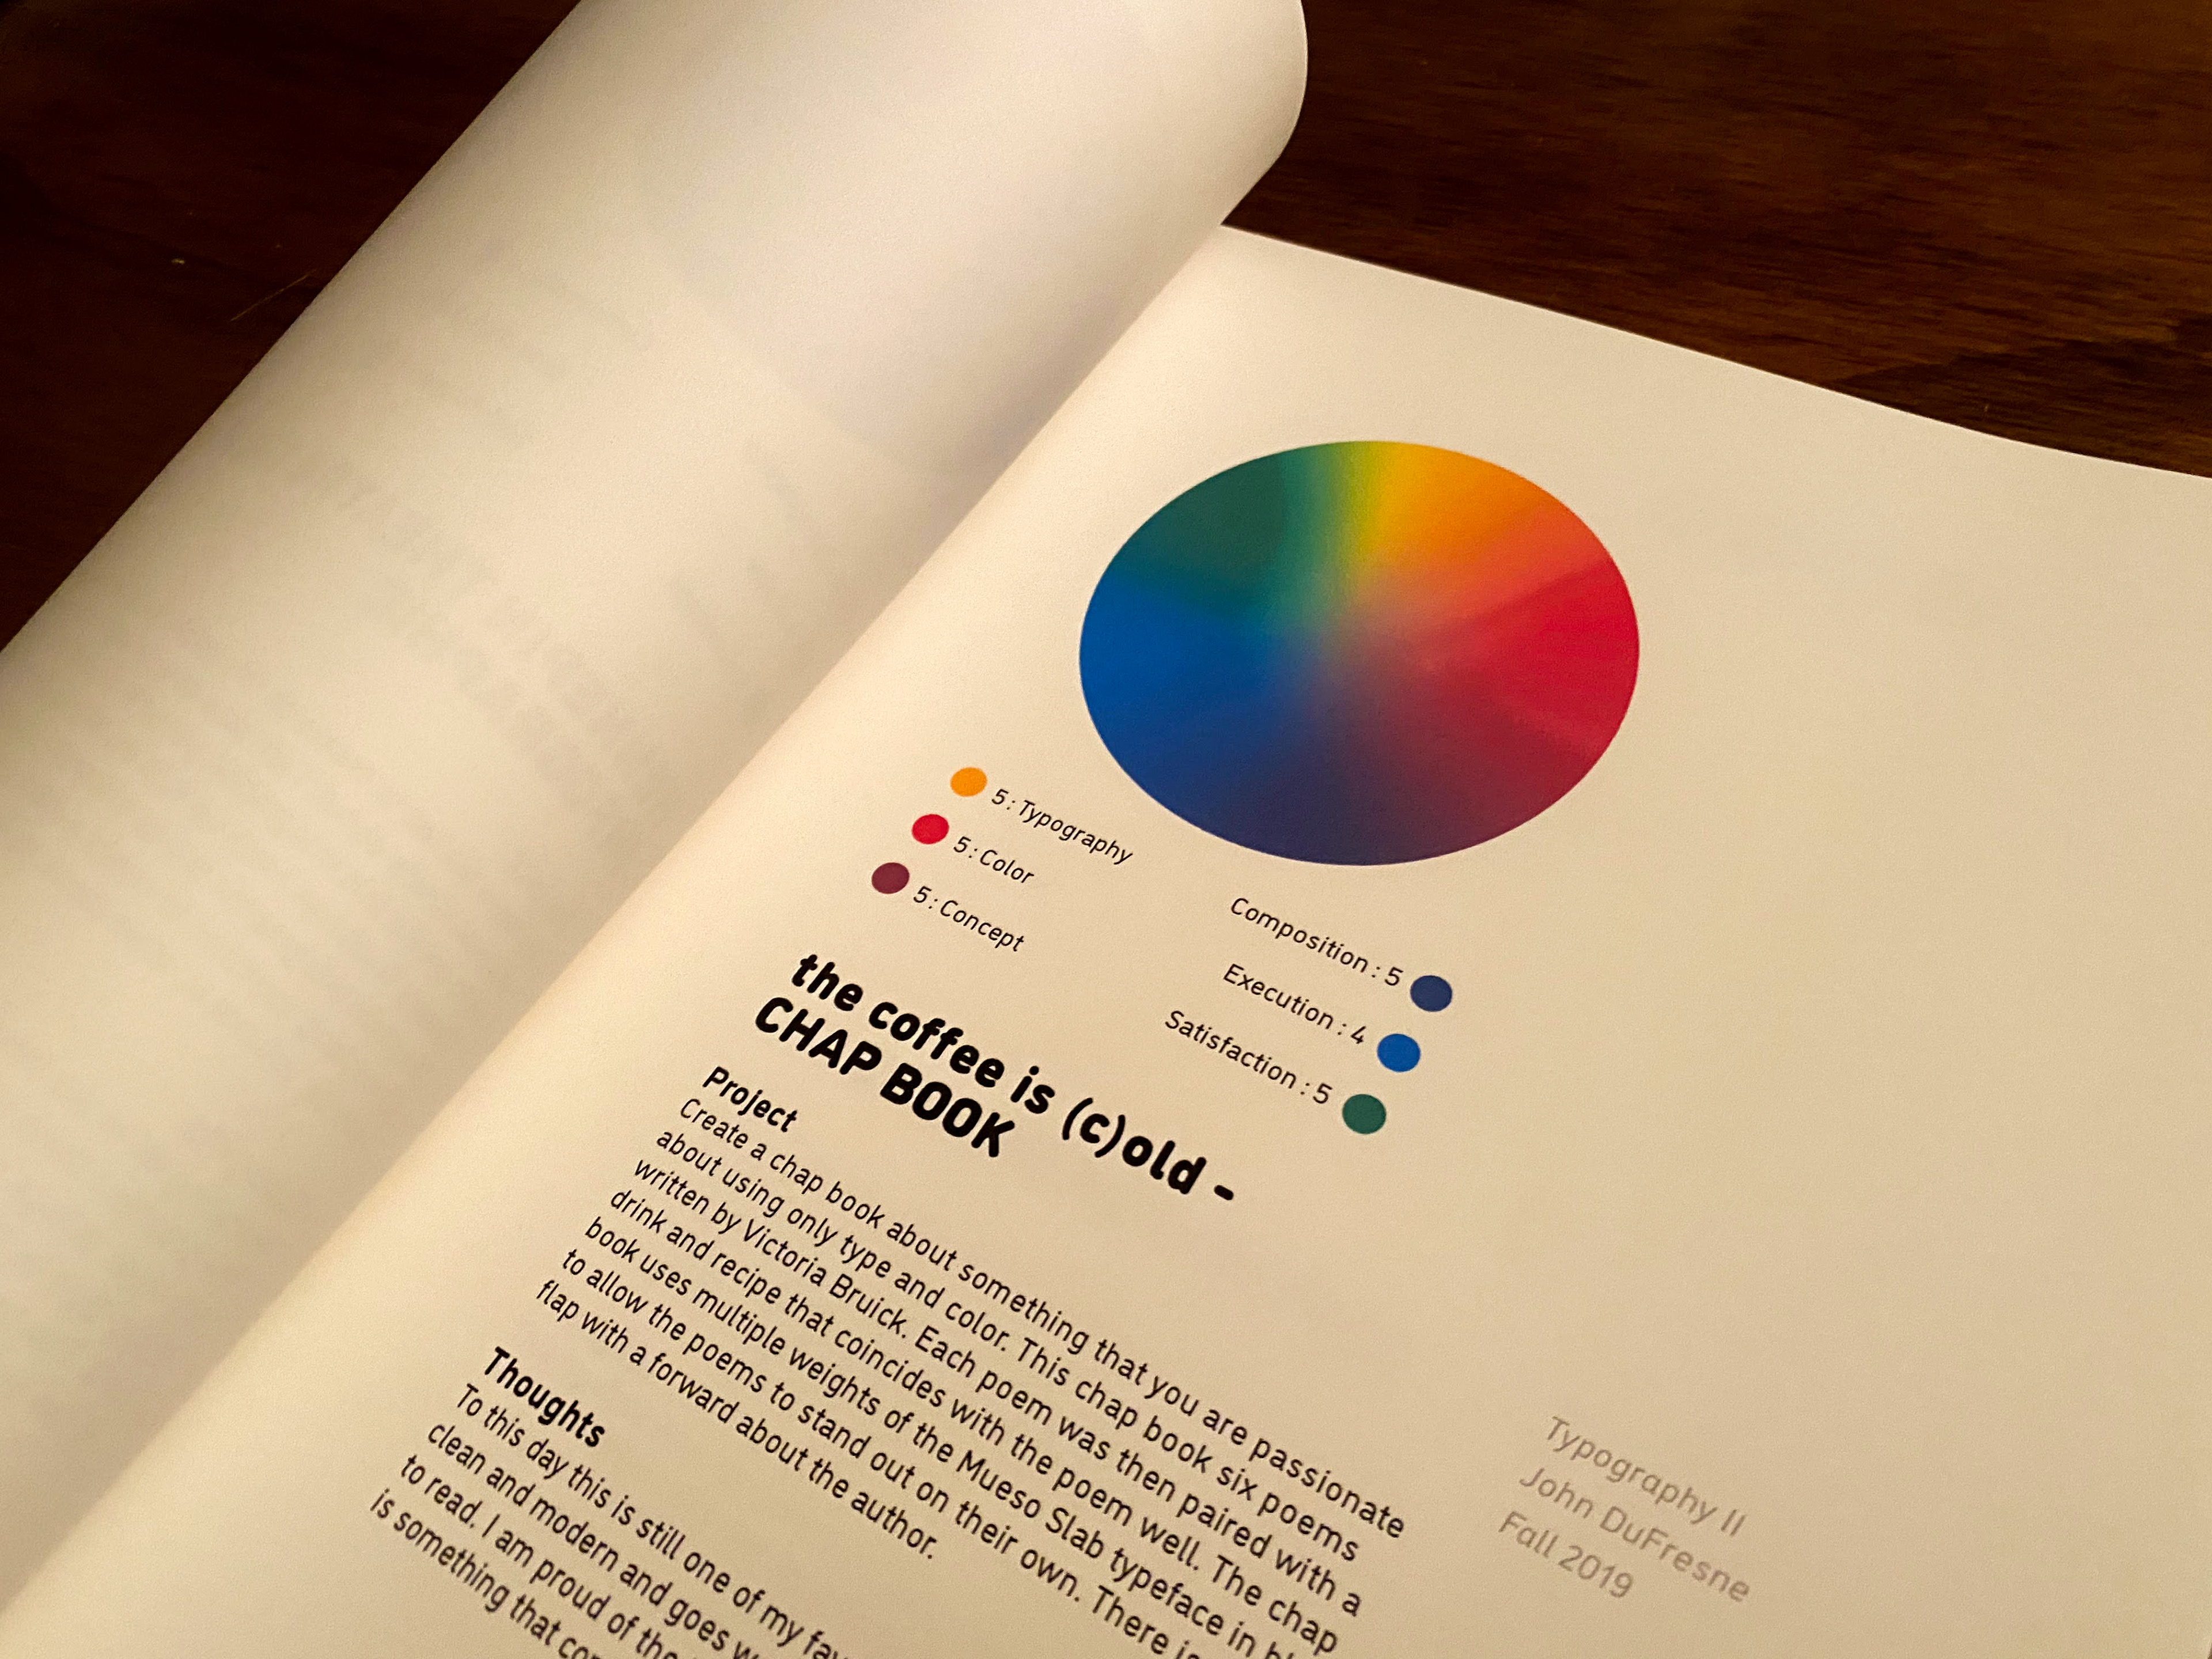
This inventory is a book of twenty-five projects that I have completed over the past four years of schooling. Starting with early icon projects, I go through and rate each of the projects based on six criteria: typography, color, concept, composition, execution, satisfaction. Each criteria point got a score from n/a to five, five being the best.
I created a pie graph using a gradient. For each criteria, the more saturated the color, the better that criteria point did. So in a whole, the more de-saturated a graph is, the worse the project was in my eyes. I also hand cut the cover page to bring the concept into the cover in a fun and interesting way.